A Validated 5.9 GHz Non-Line-Of-Sight Path-Loss and Fading Model for Inter-Vehicle Communication
Due to the ITST 6-page limit, and to keep the paper (and the thesis) focussed, the comparison to the existing NLOS path loss models was only provided via one plot. Here, you can find more plots, enabling a more detailed comparison.
The plots are separated in three groups:
|
30m Tx<->Center Distance - 23m Inter-Building Distance (Intersection 10) 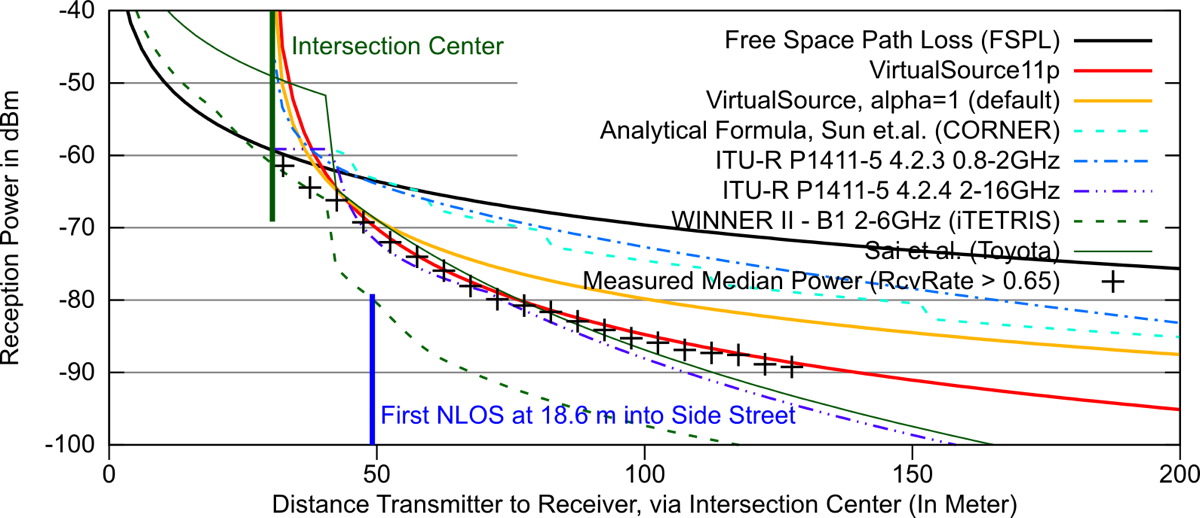
30m Tx<->Center Distance - 26m Inter-Building Distance (Intersection 11) 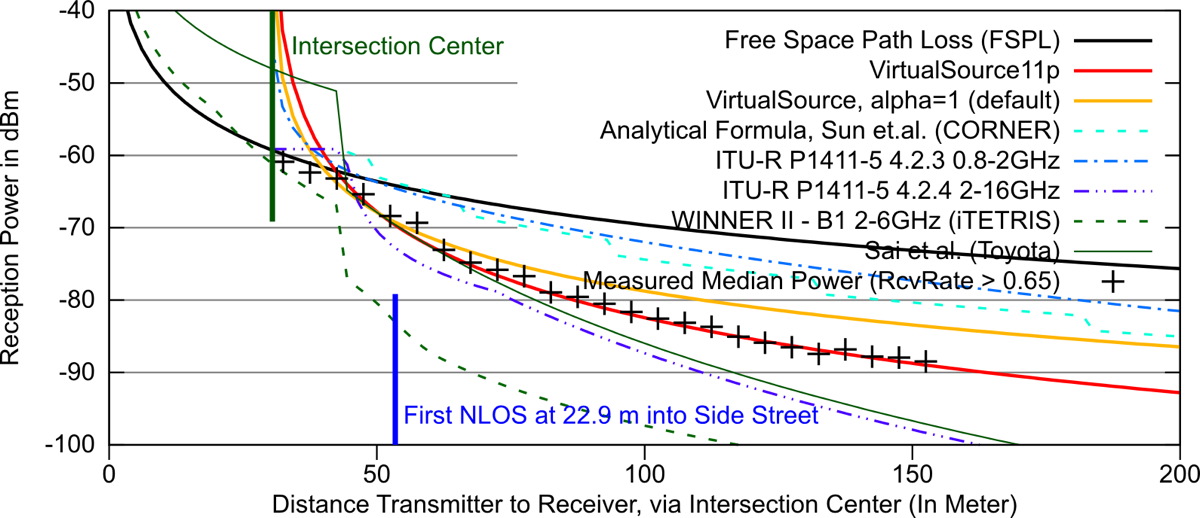
30m Tx<->Center Distance - 30m Inter-Building Distance (Intersection 20) 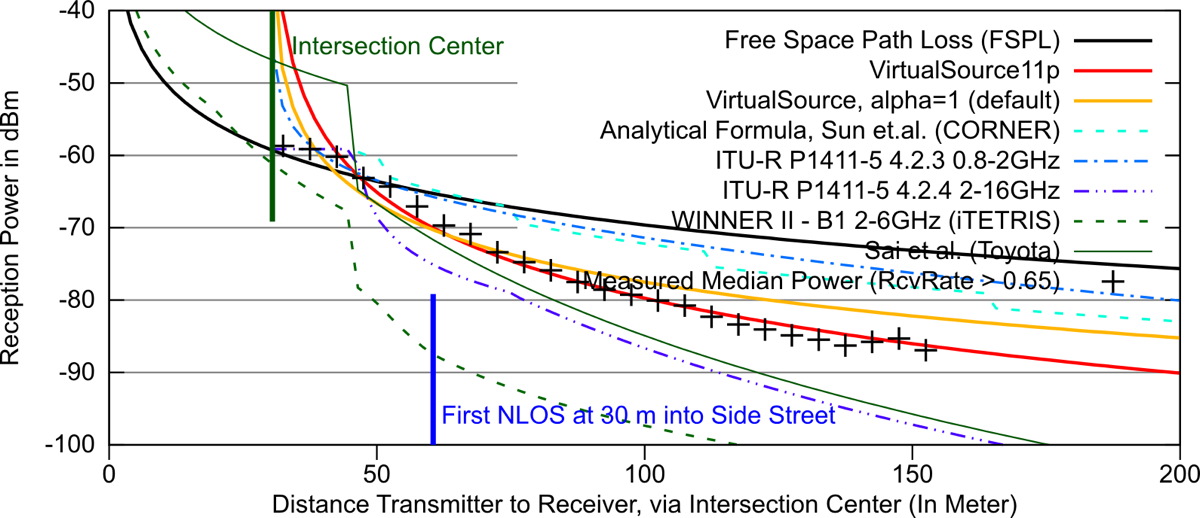
|
Note: Intersection 11 is used here, as this is the only one measured with the transmitter at all three distances, 30, 60 and 100m.
This research was executed by Thomas Mangel at BMW Group Research and Technology, in 2010/2011. Thanks for hosting goes to the Decentralized Systems and Network Services Research Group at the Karlsruhe Institute of Technology.